Smelter feed pile vs. slag heap: telling them apart in satellite imagery
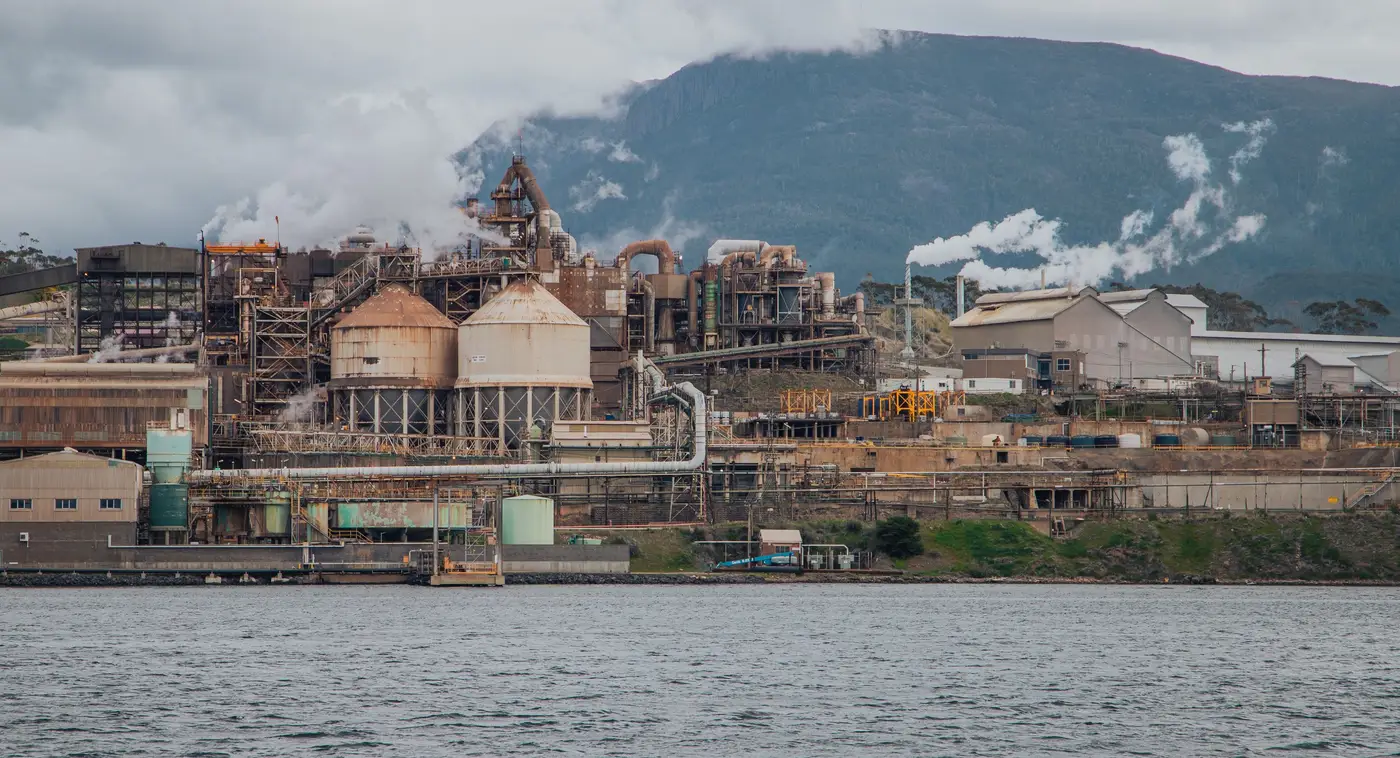
Pull up a smelter complex in any reasonably recent satellite pass and you'll usually see two or three piles that look, at a glance, like the same gray-brown lump. One of them is feedstock on its way into the furnace. Another might be slag, already smelted and stripped of most of its value, sitting there because moving it costs money nobody wants to spend this quarter. Mixing the two up in a stockpile read throws off a feed-availability estimate or a waste-accumulation trend, and if you're tracking draw-down against a disclosed throughput number, that mismatch compounds fast.
There's no single clean rule, but there are a few things that hold up pile after pile, site after site.
Location on the plant footprint tells you most of the story
Feed stockpiles sit upstream of the furnace or converter, usually close to a rail spur, conveyor head, or a stacker-reclaimer line. They're positioned for throughput: the plant wants that ore or concentrate moving in a straight shot to the charge floor with minimal rehandling. Slag, by contrast, gets dumped downstream, often well off to one side of the main process train, sometimes along a haul road that leads to a dump area with no rail or belt infrastructure feeding back into it. If a pile sits next to inbound rail with loaded hoppers parked nearby, that's feed. If it sits at the end of a truck track with no inbound logistics touching it, that's almost always slag or another waste stream.
Elevation and terrain cues help too. Slag dumps tend to grow outward over years into irregular, sprawling footprints because operators just keep tipping at the edge. Feed piles get reclaimed from one end as fast as they're built up from the other, so they hold a tighter, more consistent shape over time even as volume changes.
Shape, texture and tone in the imagery
At sub-meter resolution you can read texture, not just footprint. Ore and concentrate piles built by stacker tend toward smooth, ridged conical or windrow shapes with consistent slope angles, a function of the stacking equipment and the material's angle of repose. Slag, especially air-cooled slag, often reads rougher and lumpier in RGB, with a blocky, broken-up surface because it's dumped rather than stacked, and because slag chunks run larger than crushed ore or concentrate fines and sit at uneven sizes across the pile face.
Tone matters less than people expect since both materials often land in a similar gray-to-dark-brown range, but concentrate piles (especially sulfide concentrates) can show a darker, more saturated tone when damp, and slag piles frequently carry a duller, more matte surface once weathered. Treat tone as a secondary cue, not a primary one. Geometry and plant position will get you further than color alone.
The growth curve is the real tell
If you're watching a site weekly rather than looking at a single frame, the clearest signal isn't shape at all. It's behavior over time. A feed pile cycles: it builds on inbound shipment or mine delivery, then draws down as the furnace consumes it, often in a sawtooth pattern that tracks loosely with known shipping schedules or production rates. A slag heap almost never draws down. It just grows, sometimes in visible lifts or benches as new dumping areas get opened, until the operator eventually starts hauling it off-site for aggregate use or disposal, at which point it flattens or shrinks all at once rather than cycling.
That asymmetry, one pile breathing in and out, the other only inhaling, is usually enough on its own to settle an identification you couldn't make confidently from a single image.
None of this replaces watching the site over consecutive passes. A one-off satellite image can leave you guessing which pile is which; a weekly series across the same footprint resolves it fast because the behavior pattern does the work that shape and tone alone can't always finish. Bulk Stockpile Index builds exactly that kind of weekly volumetric series for named mine, smelter and port sites, so pile identity and draw-down pattern show up in the data instead of in a guess. If your desk is still reconciling feed availability against quarterly disclosure alone, it might be worth seeing what a weekly series on your sites looks like.